Brief overview of the kubectl command-line tool
In launching containerized applications into Kubernetes, the kubectl tool has made deploying and managing a cluster easy. From a user's point of view, kubectl is your cockpit for controlling Kubernetes. It will make it possible to perform all CRUD operations on Kubernetes resources, such as creating, reading, updating, and deleting.
Steps we'll cover in this article:
- Introducing describe as a way to get detailed information about Kubernetes resources
- Behind the Scenes: What Does describe Really Do?
- Using kubectl describe with Different Resources
- Decoding the Output
- Limitations and Alternatives
- Best Practices and Tips
- Deep Dive: Custom Resources and kubectl describe
Introducing describe as a way to get detailed information about Kubernetes resources
It's a command to describe any resource in Kubernetes. It's used to display data from a single or even a collection of resources. In order to create detailed descriptions of a resource or a set of resources, this command is combined with several API Calls. This can be particularly useful for debugging and understanding the lifecycle and state transitions of the resource.
Behind the Scenes: What Does describe Really Do?
Explanation of how describe fetches detailed state and configuration data
This command has two helpful uses. First, it offers a comprehensive description and understanding of the current state, including deployment replicas, service endpoints, and pod status. Second, it provides the resource's configuration, such as resource limitations, labels, environment variables, and annotations that are specified in the YAML or JSON manifest.
Differentiating between describe and other kubectl commands like get
kubectl describe is a strong command that gives you a very detailed and thorough understanding of Kubernetes resources. This is really useful when debugging. kubectl get, on the other hand, is much easier and quicker to use for retrieving and summarizing resources with their status.
Using kubectl describe with Different Resources
Describing pods, deployments, services:
Using the describe command, you can describe different types of kubernetes resources, like pods, deployments, services, and many others. This can be achieved by running a corresponding command:
kubectl describe [type-of-resource] [name-of-resource]
If you donot give the resource name, then the describe command will display the information of all resources present in the namespace.
Describe Pods:
It gets a lot of errors since it heavily depends on the pod manifest or application configurations. Thus, it's critical to spot the error as soon as possible. Examining the logs is one way to find out what happened in the pod, but examining the events would provide a quicker understanding of the problem.
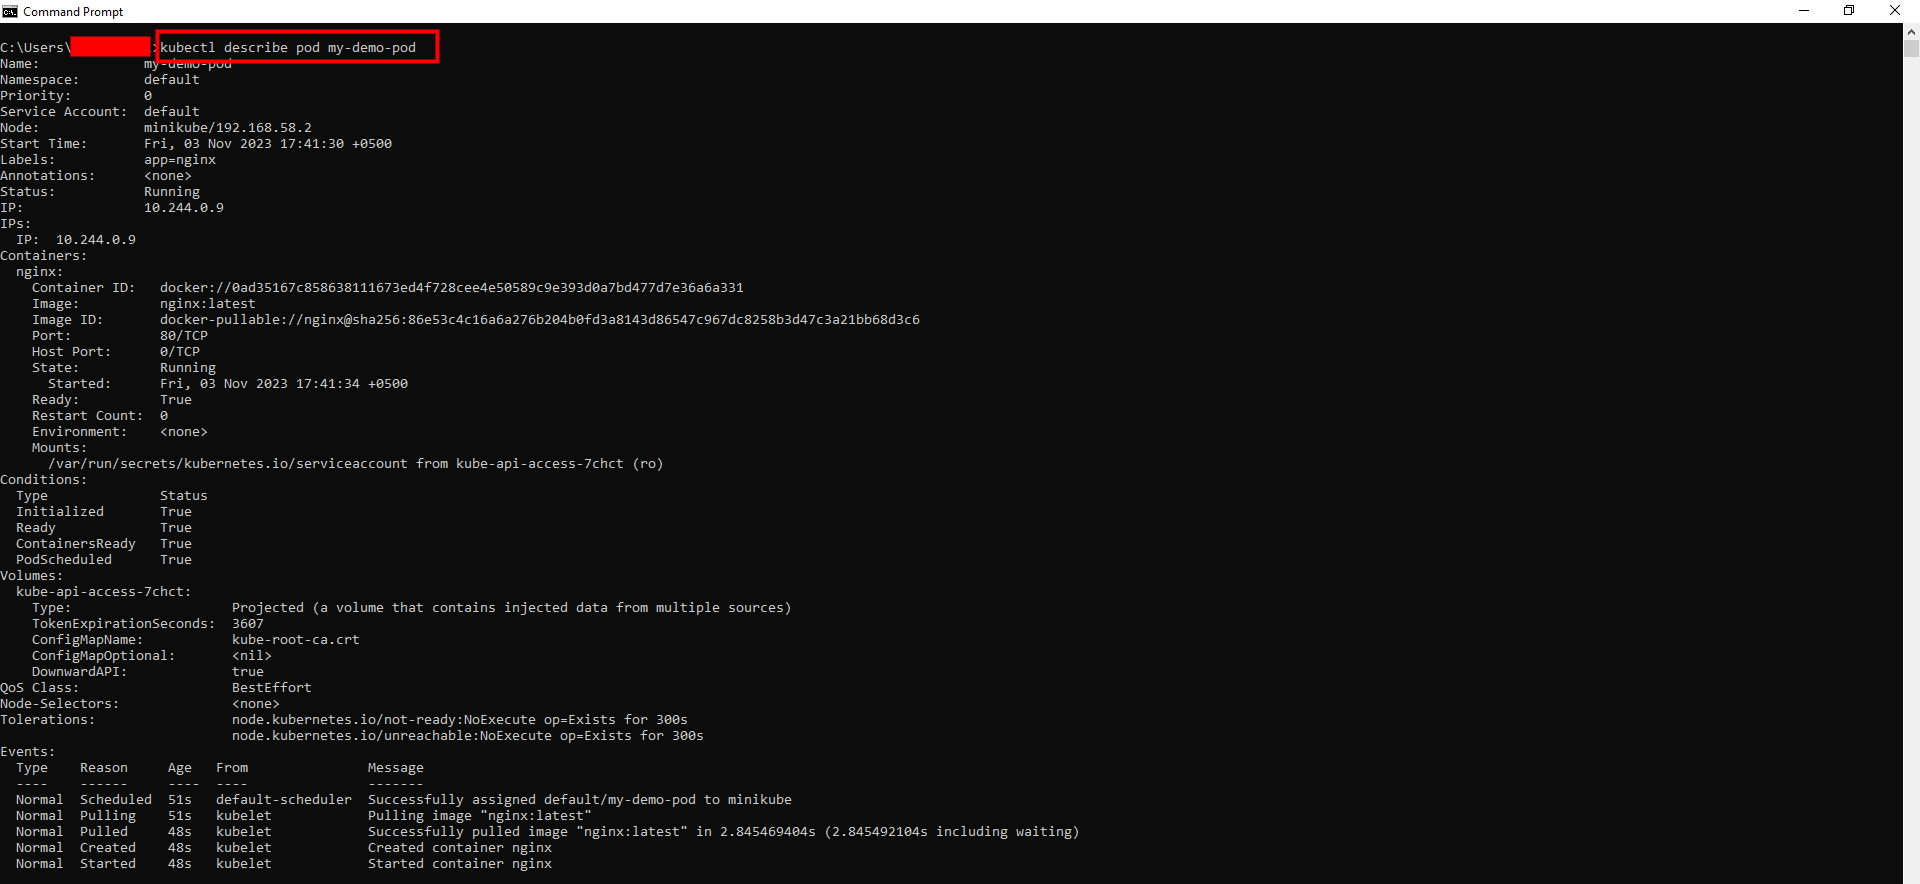
For a specific pod, you can use the following command to see the detailed information, such as its status, containers, volumes, events, etc:
kubectl describe pod [name_of_pod
For Example, using the above command, we can describe the 'my-demo-pod' running on our minikube node:

Describe Deployments:
Deployments are basically controllers used for determining and keeping the desired state of your application through the creation and update of the pods. They make sure that a specific number of pods are up and healthy.
For a specific deployment, you can use the command below to see the detailed information such as its labels, strategy, selector, template, conditions, events, etc:
kubectl describe deployment [name-of-deployment]
The below output shows that using the above command, we have described the 'my-demo-deployment':

Describe Services:
The network connectivity between the Kubernetes components is provided by these components. Any network-related problem is shown in the services whenever it occurs.
You need to utilize the describe command below to describe a service in order to comprehend what happened within the cluster's networking:
kubectl describe service [name-of-service]
For Example, in our case, we have a service with the name 'example-service' in a namespace named 'example-namespace'. By utilizing the command above, we could see that the service has no endpoint, meaning it is unable to reach any of the pods:

Decoding the Output
Explaining common sections in the output
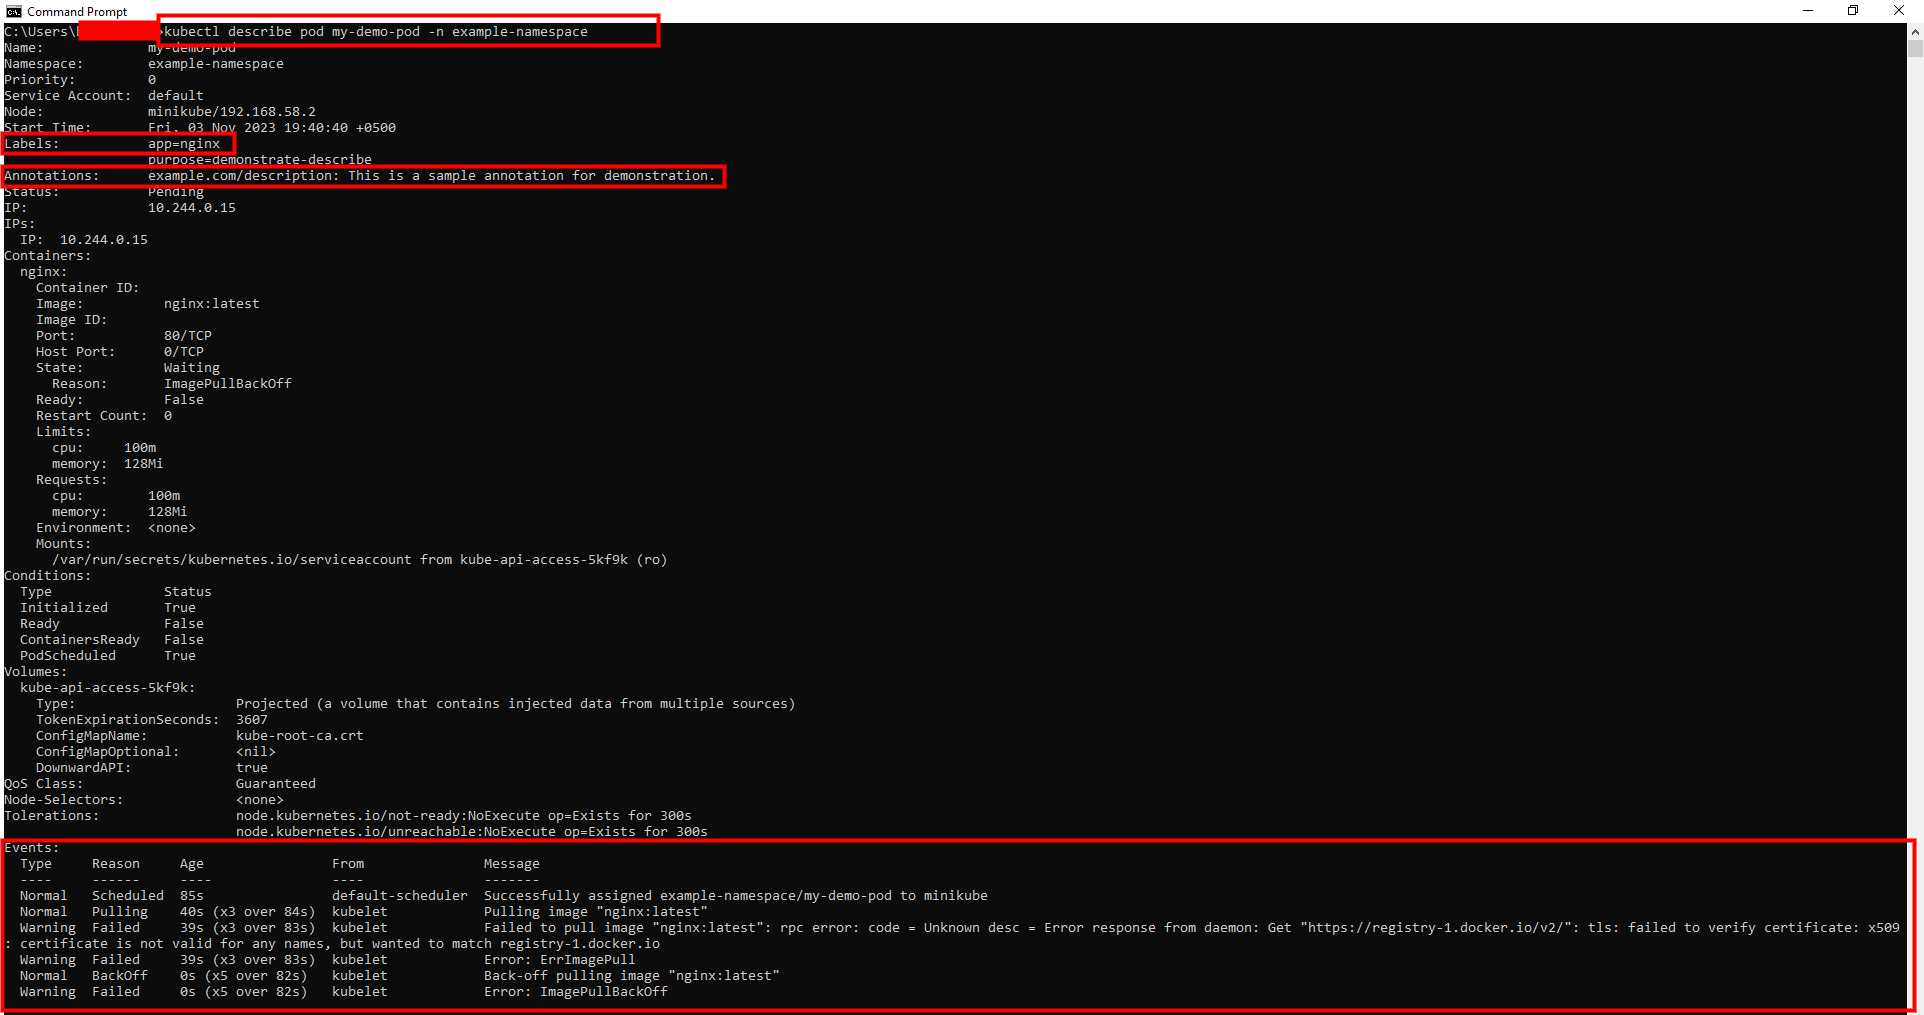
The output consists of several sections that provide different aspects of the resource's state and configuration. Some of the common sections are:
Events:
Kubernetes events, such as pod scheduling, scaling events, or service updates, can offer insightful information about past activities. You may review the configurations after you've verified that the events are normal and as expected. It is especially helpful when confirming that the resource's current state matches the configuration you provided.
Annotations:
This section shows annotations used as 'non-identifying information/metadata' that are irrelevant to Kubernetes because they aren't used internally. Annotation keys and values do not have any constraints. Therefore, annotations are preferable if you wish to provide details about a particular resource or other people who worked on it.
Labels:
This part consists of different key-value pairs, which are used to identify and select the desired resource. Developers use labels to categorize or filter resources according to similar properties like application name, environment, tier, version, etc. Selectors use these labels to identify resources with the same label values.
The Below Output Highlights the common Sections:

Limitations and Alternatives
Scenarios where describe might not provide enough information.
Useful commands such as kubectl describe is an important tool to get more information about Kubernetes resources, but there are limits and alternatives. Here are some scenarios where describe might not provide enough information:
- The describe command will not allow you to access logs of your containers if you would like to see what is outputted by your containers or the error messages in them.
- The describe command will not tell you the performance metrics like the CPU and memory usage, the network and disk throughput, the latency and the error rate, etc., that are related to your resources when you want to see how they perform or how they are utilized.
- The describe command does not give you the historical or trend data of your resources, like how their statuses have changed, what their configurations are, events, metrics and so on.
Introducing alternatives like logs or third-party monitoring tools
In order to view your container logs with respect to both the standard input and standard output, you would have to run kubectl logs command. A third-party monitoring tool with the ability to collect and present important real-time metrics is also required. As an example, you may employ Prometheus and Grafana to track your Kubernetes cluster and illustrate your metrics. Apart from that, other third-party tools like Elasticsearch, Fluentd, and Kibana can be used to log and trace your Kubernetes cluster.
Best Practices and Tips
How to use describe effectively
Specify Namespace:
You can specify the namespace of the resource that you want to describe using the --namespace or -n flag. It assists you to prevent confusion and mismanagement of such resources with similar names from different namespaces.
Use Selectors:
You can indicate specific resource labels with the --selector or -l flag in order to describe only selected resources. It will enable you to keep out irrelevant resources and focus on relevant ones.
Understand Usage:
To understand the usage and options for describe, use --help or -h. This will allow you to gather more information on the syntax and the parameters allowed in the command.
Highlighting common pitfalls and how to avoid them
- When using the
kubectl describe, some users may overlook crucial information in the 'Events' section. - Real-time data isn't provided through this command, so it's important to always remember that you're getting a snapshot of the resources at the time of command execution. For real-time monitoring, consider using other tools.
- The reason for a pod not being scheduled could be due to resource quotas and limits set on your namespaces and resources. To ensure you don't miss this information, regularly review them.
- A comprehensive understanding of an issue can be achieved by using other commands like
kubectl logs,kubectl get, andkubectl execin addition tokubectl describe.
Deep Dive: Custom Resources and kubectl describe
Using describe with CRDs (Custom Resource Definitions)
Custom resources are extensions of the Kubernetes API. It allows you to define and manage your own resources in a cluster. Essentially, you can create, update, and manage instances of new resource types by defining a Custom Resource Definition (CRD). Using kubectl describe, you can get an in-depth overview of a single custom resource or group of custom resources, including their current state, specifications, and associated events, which can help you understand and troubleshoot.
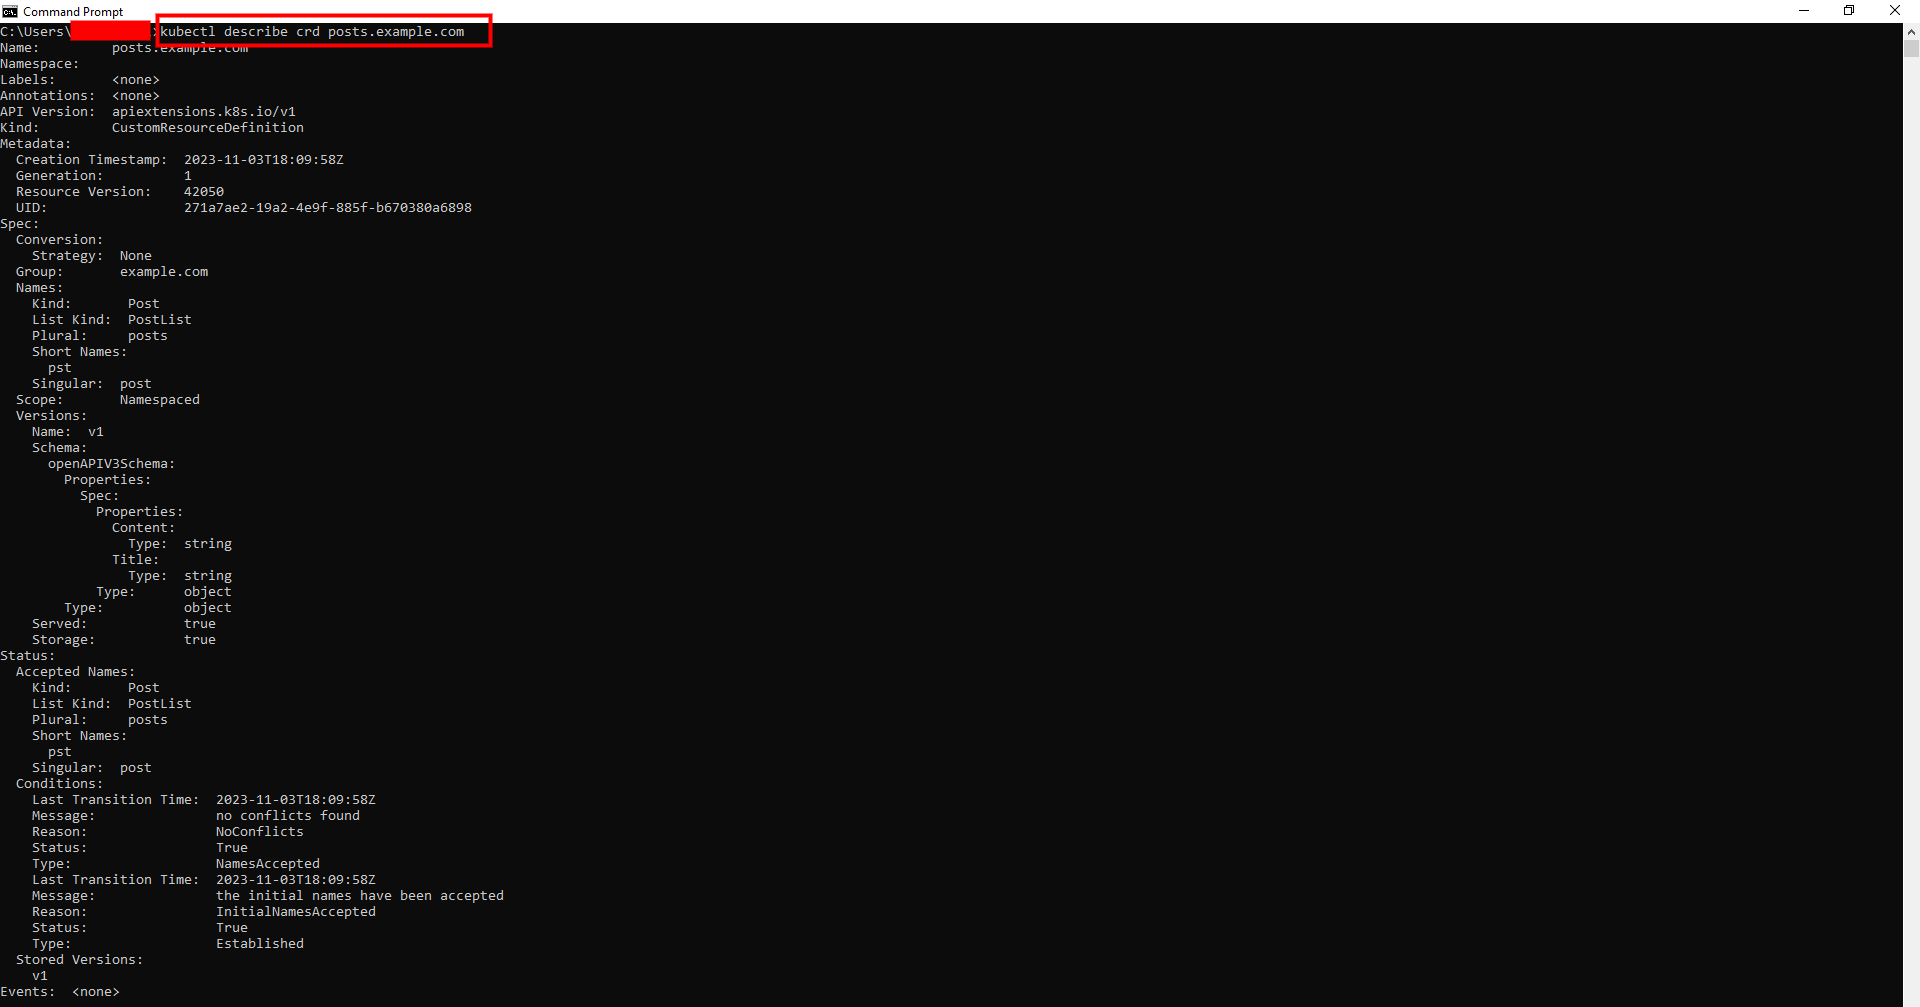
If we have a custom resource definition named posts.example.com, we can use this command to describe it:
kubectl describe crd posts.example.com
The output will show you a detailed description of the custom resource definition:

Name: It is a unique name of CRD(Custom Resource Definition) Scope: This shows whether the custom resources are restricted to the cluster scope (Cluster) or allowed to exist in different namespaces (Namespaced). Version: This indicates the custom resource's API version. Kind: It is a kind of resource that represents the type of custom object defined by the CRD(Custom Resource Definition). Validation Schema: It specifies the custom resource's structure, allowed properties, and validation rules.
Conclusion: The Power of Insight
Thе kubеctl dеscribе command is more than just a utility; it is a window into thе intricatе workings of your Kubеrnеtеs clustеr. From undеrstanding thе statе of pods, dеploymеnts, and sеrvicеs to diving dееp into custom rеsourcеs, kubеctl dеscribе еnsurеs that administrators and dеvеlopеrs arе always wеll-informеd and еquippеd to makе timеly dеcisions.
Embracing kubеctl dеscribе as a primary dеbugging tool can significantly еnhancе your troublеshooting еxpеriеncе. Its ability to prеsеnt a comprеhеnsivе snapshot of your rеsourcеs, couplеd with its еasе of usе, makеs it an indispеnsablе ally. Wе еncouragе rеadеrs to incorporatе kubеctl dеscribе into thеir rеgular practicеs and еxplorе its potеntial to strеamlinе thе dеbugging procеss.

